The Wave Count Since the 2009 Low
This post is this blog's "Daneric's Opus" on why the current Elliott wave structure from the 2009 price low of 666 SPX (devilish yes?) is counted as a corrective three wave structure - specifically cycle wave b - as the preferred primary Elliott Wave count.
This "three" wave structure is currently counted as a "double three" - specifically a double 5-3-5 zigzag structure, or "double zigzag". The degree wave labels are derived from Frost and Prechter's "Elliott Wave Principle" which can be ordered through Elliott Wave International. Join Club Elliott Wave International (CLUB EWI) by clicking on my links to them (to the left sidebar) and then order the book. (Side note: I get a small commission from Elliott Wave International (EWI) from any EWI product or service ordered via your signing up to be a FREE Club EWI through my website links)
This post will be a technical wave count explanation. I'll try and keep it focused however I'll start off on a little background on "why" the cycle wave b to begin with. The post starts out with a background discussion on why this is cycle wave b structure from the 2009 low. Then it primarily deals with why it best counts as a corrective "three" wave structure and not an impulsive wave (5 wave structure) and details the finer subwaves of the cyclic wave b.
WHY THE CYCLE WAVE b?
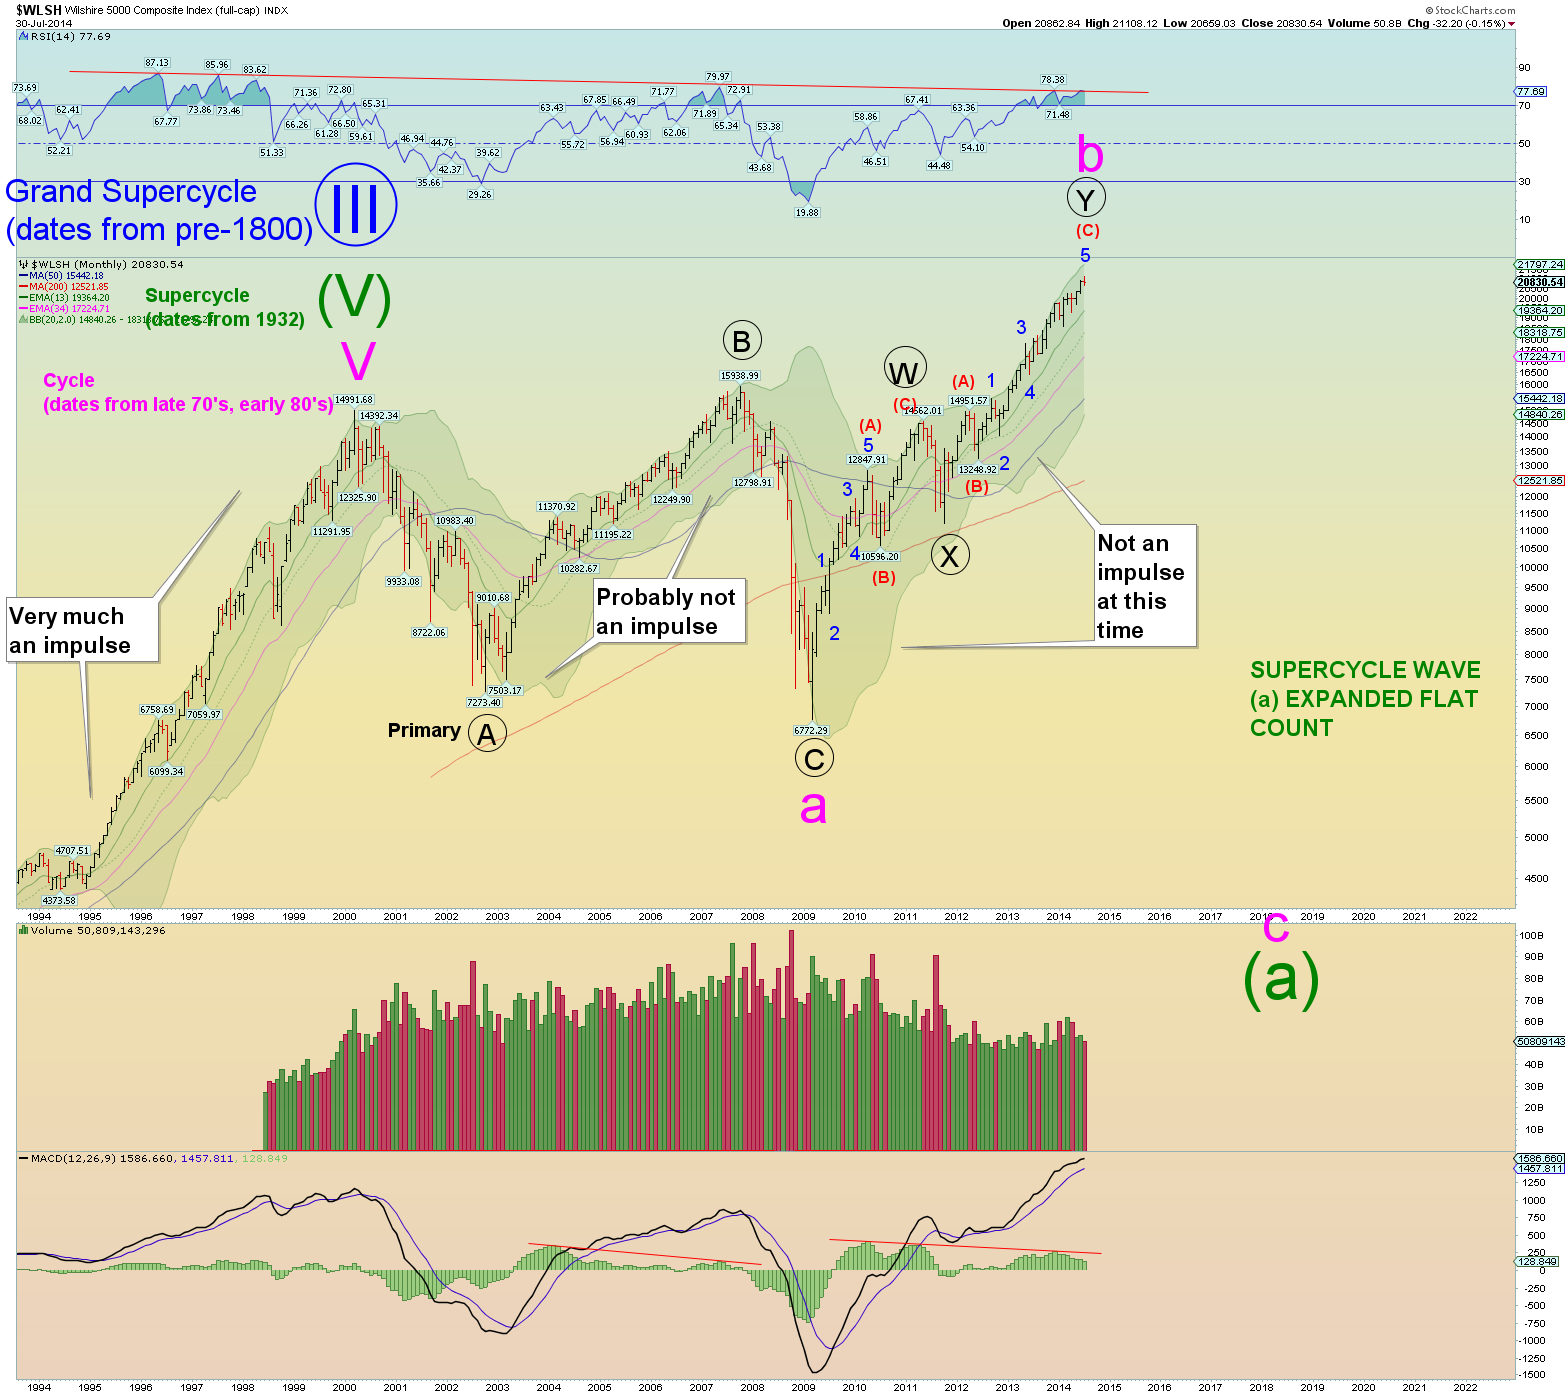
This is in large part an influence from Robert Prechter of EWI. First, I subscribe to the count that the year 1999-2000 was more or less the "peak" in a Supercycle wave (V) of a Grand Supercycle wave (III) - see labeling in my left hand blog column. Robert Prechter, through his Elliott Wave International, has been publishing EW charts for many decades on why the year 1999 - 2000 was a likely Grand Supercycle wave III peak. His (and Frost) book, Elliott Wave Principle, Key To Market Behavior, details much and why this long term count exists. I Highly recommend it, as it is the Elliott Wave "bible" so to speak. At any rate, I adhere to his wave labeling directory schemes.

The primary long-term count is a Super-cycle degree (a) expanded flat count. This is where the middle cycle-sized "b" wave price peaks higher than the actual previous market peak and than goes real low in "c" wave that exaggerates both the proceeding "a"and b waves. (You'll also see expanded flat subwave counts in my charts showing the 2009 - 2014 b wave advance below). So yes, EW theory allows for new nominal market highs even though it is correcting the preceding wave. In this case the preceding wave was cycle wave "a"at the 09 low in the form as (also) expanded flat.
(NOTE: I often show and use the Wilshire5000 as a superior wave structure in conjunction with the SPX. The Wilshire represents total social mood better in my opinion. but sometimes the SPX is just cooler to use because people like it better. But you'll see both in this blog. Prechter prefers the DOW wave structure. My opinion is that the DOW structure was superior up until the early 1980's, but the changing nature of the modern market makes a broader index more relevant for wave counting at this time).
In the simplest terms, Mr. Prechter describes "B" waves of all wave degrees as basically false waves built on shaky foundations and shaky economics. If you agree this is the biggest bullshit economic recovery in the history of recoveries, then you could easily comprehend what a huge "bullshit" cycle-sized b wave this entails. Its the mother-of-all-B-waves! Which is the same as saying its the mother-of-all-corrective waves (even though it is nominally higher priced than in 2007). And the fact that it is a cyclic b wave is of historic proportions. But it all makes sense, doesn't it? Does it feel like a true bull market? Or does it feel like the biggest bullshit market? Only a 5 wave structure impulse wave would be a true bull market, and we have yet to have that overall since the 2009 low. I posit that this is not a true bull market impulse wave from the 2009 low based on long term count, current wave structure over the last 5 years, and the heartfelt feeling that I sense social mood is still eroding in the long term since the year 2000 which indicates "corrective" since the year 2000, not impulsive!
Again, if you subscribe to Elliott Wave International (my links in left hand column) you would understand the long term analysis of why this is theorized as a cyclic-sized "b" wave corrective rather than an impulsive move. One aspect that Mr. Prechter points out is the DOW/GOLD ratio which peaked severely in the year 2000 at an extreme ratio. It is nowhere near that now. You could also use the PPI (producers price index) /DOW ratio to account for inflation over the last 14 years and also see that the market is merely correcting from where the true social mood peak was at the turn of the 21st century. In other words, in REAL MONEY the market HAS GONE NOWHERE IN THE LAST 14 YEARS! This is not necessarily "proof" of the current long term count but it is largely supportive nonetheless. In other words, inflation is hiding the bullshit. You know it and I do too. The cyclic b wave makes perfect sense. Its correcting the waves since the true 2000(ish) peak but its a false promise nonetheless.
ANALYSIS OF THE CURRENT CYCLE b WAVE COUNT SINCE 2009 LOW
The detailed analysis will be broken up into several charts. The premise of the cycle b wave is that it consists what is known as a "double zigzag" count. Basically the premise of a double zigzag is that one 5-3-5 zigzag corrective pattern is not enough price and/or time, therefore the market doubles the corrective pattern in an effort to fulfill a corrective mandate to the preceding wave. Social mood determines this. The preceding wave in this case was cyclic expanded flat wave "a" that existed from 2000 - 2009. See the Wilshire chart above for the big pink "a".
TERMINOLOGY OF A DOUBLE ZIGZAG
A "corrective" wave is simply known as an A-B-C "three" wave corrective pattern in Elliott Wave terminology. A simple zigzag is just such a labeled wave. It has 5 waves followed by 3, followed by another 5 wave pattern. Thus the label 5-3-5 zigzag. But what if the market traces such a 5-3-5 pattern and then deems it is "not enough of a corrective". Prechter (and Frost) solved this problem by largely observing that the market will double its corrective pattern in either time (sideways double flat) or price (double zigzag) or by some other complex combination.
In this case, I posit the market is in a double zigzag corrective pattern due to the time requirements of cycle b and the price requirements. In other words, the market traced a single zigzag and realized this was inadequate for the requirements of current social mood cyclic demands. So it therefore doubled its pattern. Yet this doubled zigzag pattern is still considered a corrective pattern overall (these are the rules!).
Hence even though the market traced a clear 5-3-5 zigzag corrective pattern to the peak in 2011, social mood turned out to be of cyclic proportion and thus the market required a doubling of the 5-3-5- zigzag pattern to fulfill its cyclic mood cycle. Thats the premise of the current cycle b wave double zigzag count as shown below in detail in the next few charts.
TERMINOLOGY OF A COMBINATION CORRECTIVE COUNT.
Since Prechter and Frost posited "combination" corrective patterns (doubles or even triples) they came up with a labeling system that signified a
corrective combination count. In other words, those corrective patterns that, in effect, "doubled" (or in rare cases, tripled) themselves. Since a simple A-B-C zigzag would become an A-B-C - 3- A-B-C zizgag (with the "3" in between also being an A-B-C correction), they needed a convention to denote that this was a complex count and to clarify the larger degree count. Thus was born the W-X-Y denotation.
The W-X-Y denotation can exist at any wave degree. In this case since the 2009 low is premised to be a cycle-sized "b" wave the subwave count of primary (W)-(X)-(Y) signifies a double corrective pattern in this case a "double zigzag". The subwave zigzags take on the lower primary degree label. Thus (A)(B)(C) = primary wave (W) then (A)(B)(C) = primary wave (X), then (A)(B)(C) = primary wave (Y). Even though this seems like more than 3 waves, it is still considered a corrective pattern and for the sake of argument is still called a three wave pattern overall (W)(X)(Y). The W-X-Y merely denotes a complex correction but a corrective wave still the same!
(Note: the brackets () denotes circle on the chart. Sometimes its shown as an actual circle, but most times brackets are easier to work with particularly when explaining in a paragraph or putting together a small wave chart as I often do) see explanation of wave degrees in left hand ad column.)
CURRENT CHART OF PROPOSED CYCLE WAVE b
Channeling can be tricky. Yet its still in an overall channel so it still qualifies as a "three" - hence corrective since 2009!.

BREAKDOWN OF PRIMARY WAVE (W)
There is not much to say about the first zigzag of cycle wave b. Primary wave (W) was a straightforward zigzag as viewed from a long term point of view. It seemed appropriately sized, and corrected the collapse of 2008-2009 very sharply. At the peak it very much qualified for a wave 2 on the rebound but turned out to be not the case. The zigzag pattern thus doubled itself is my contemtion.
The big thing that stood out at the time was a subwave "three" wave pattern into the peak from (A) to (B) in 2011). This created a problem for my terminal count at the time. It was prophetic.

BREAKDOWN OF PRIMARY WAVE (Y)
There is lots to say about the current wave (Y) but I managed to annotate the chart with most of the points I wanted to state. So please observe the chart notes closely and they will suffice for any commentary I would add to this post.
There is lots to say about the current wave (Y) but I managed to annotate the chart with most of the points I wanted to state. So please observe the chart notes closely and they will suffice for any commentary I would add to this post.

More posts from