Elliott Wave Update ~ 16 September 2014
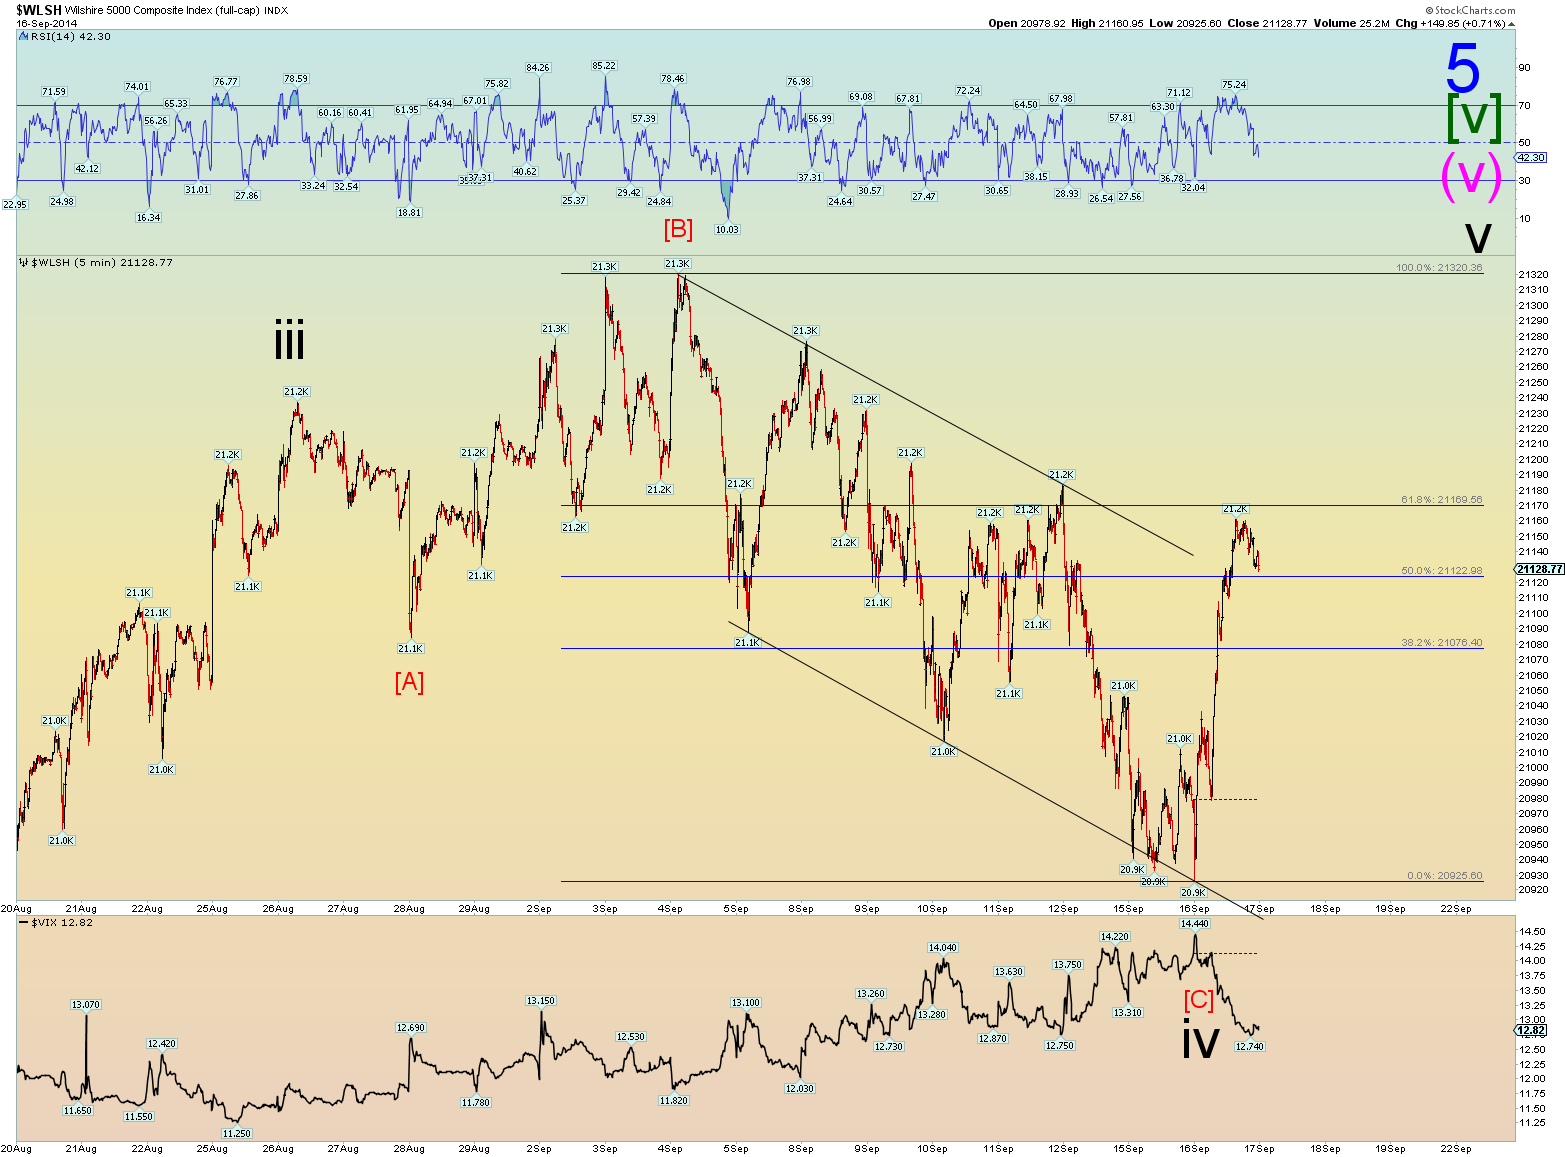
We'll use the Wilshire5000 for the short term squiggle counts. I think it gives better clarity at this moment.
It is, in effect, the same overall count as the SPX. However the Wilshire gives us better starting and ending points. For instance today the Wilshire reached a lower low before bouncing while the SPX did not. That gives us a better location to mark the start of wave counts.
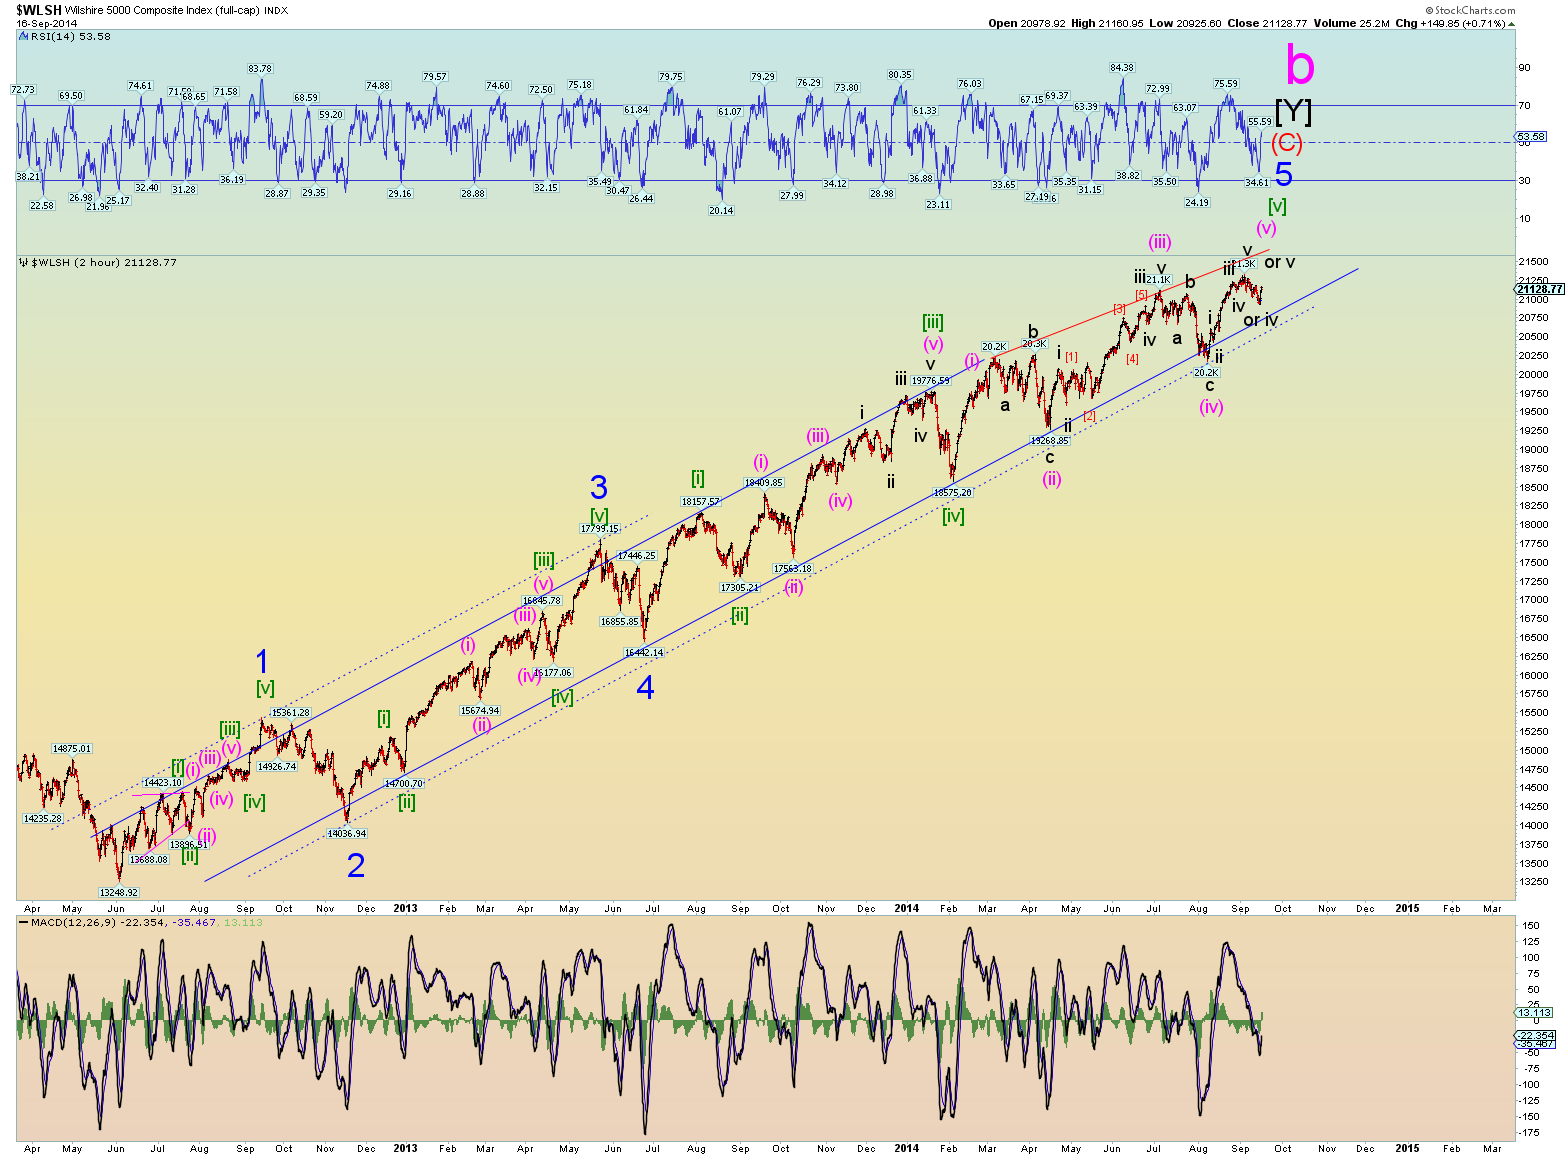
We have a couple of top squiggle options. Yesterday's post showed the SPX. Today we'll show the Wilshire in the same squiggle options.
Leading Diagonal count:


More posts from