Elliott Wave Update ~ 15 October 2014
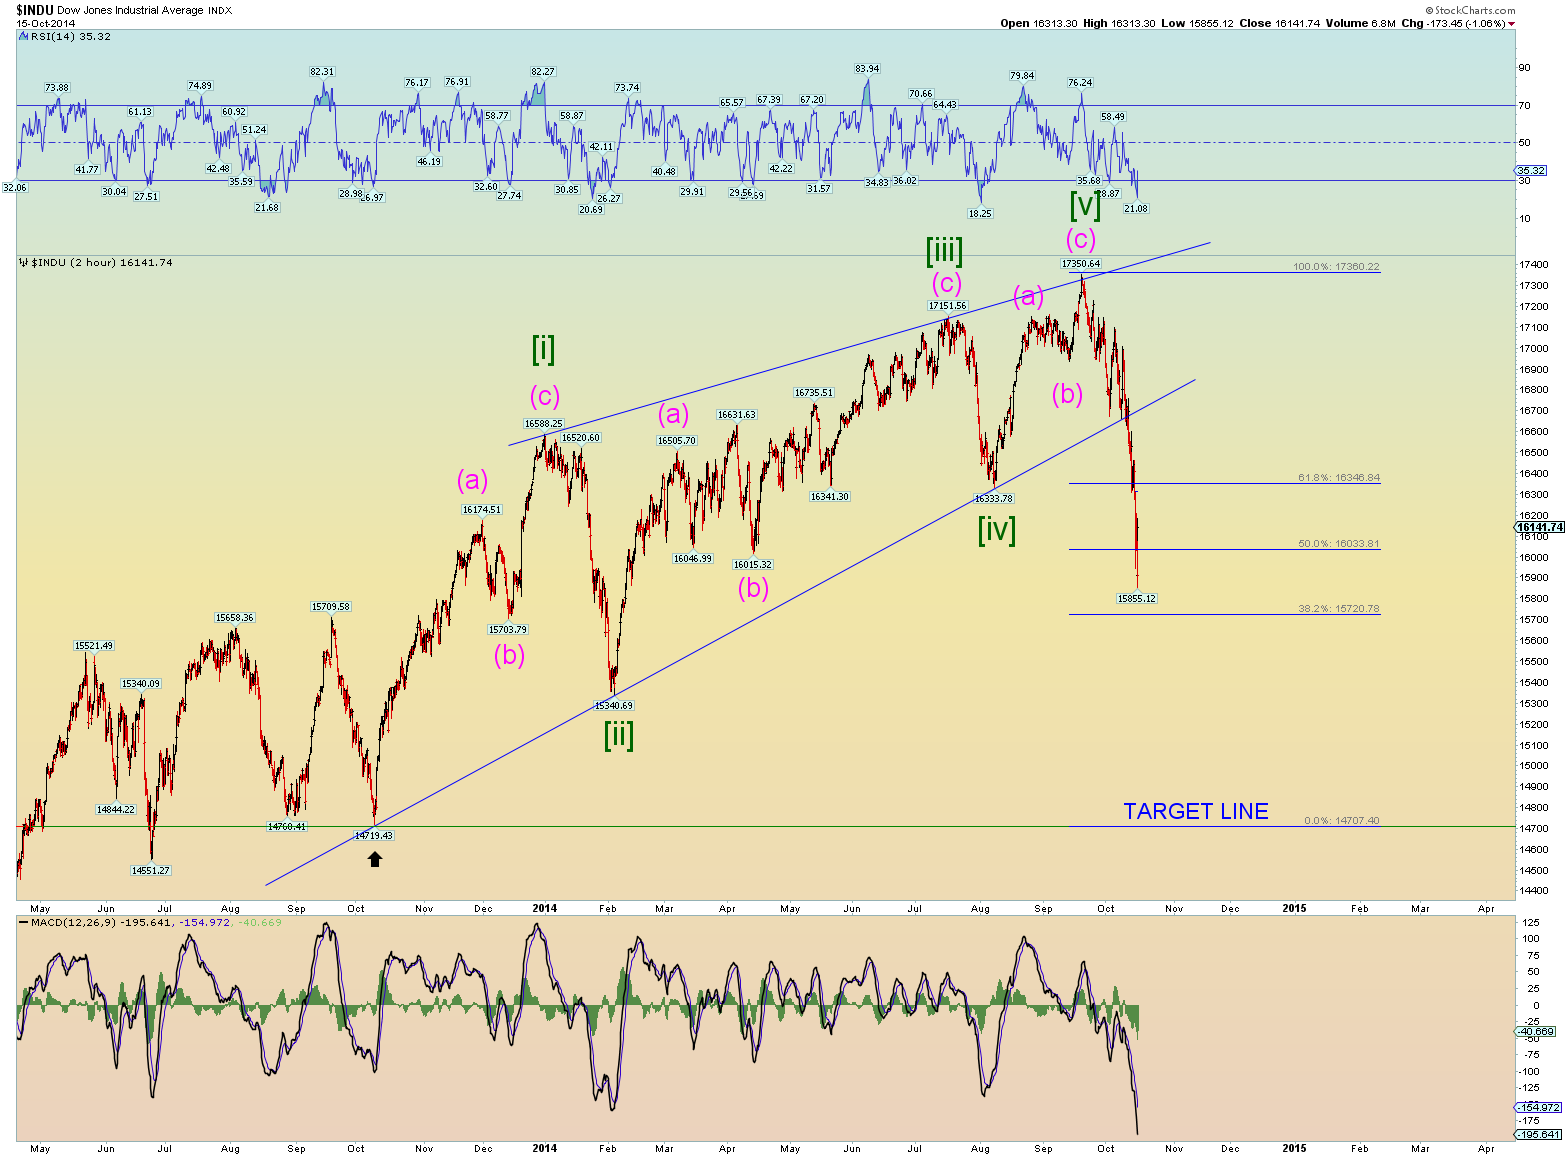
As has been suggested many times, since the DJIA ended its peak in what appears to be an ending diagonal, therefore the makings of a swift market decline back to its origin has to be respected at all times. So far this has been the case. Prices have moved well over 50% toward its minimum target.


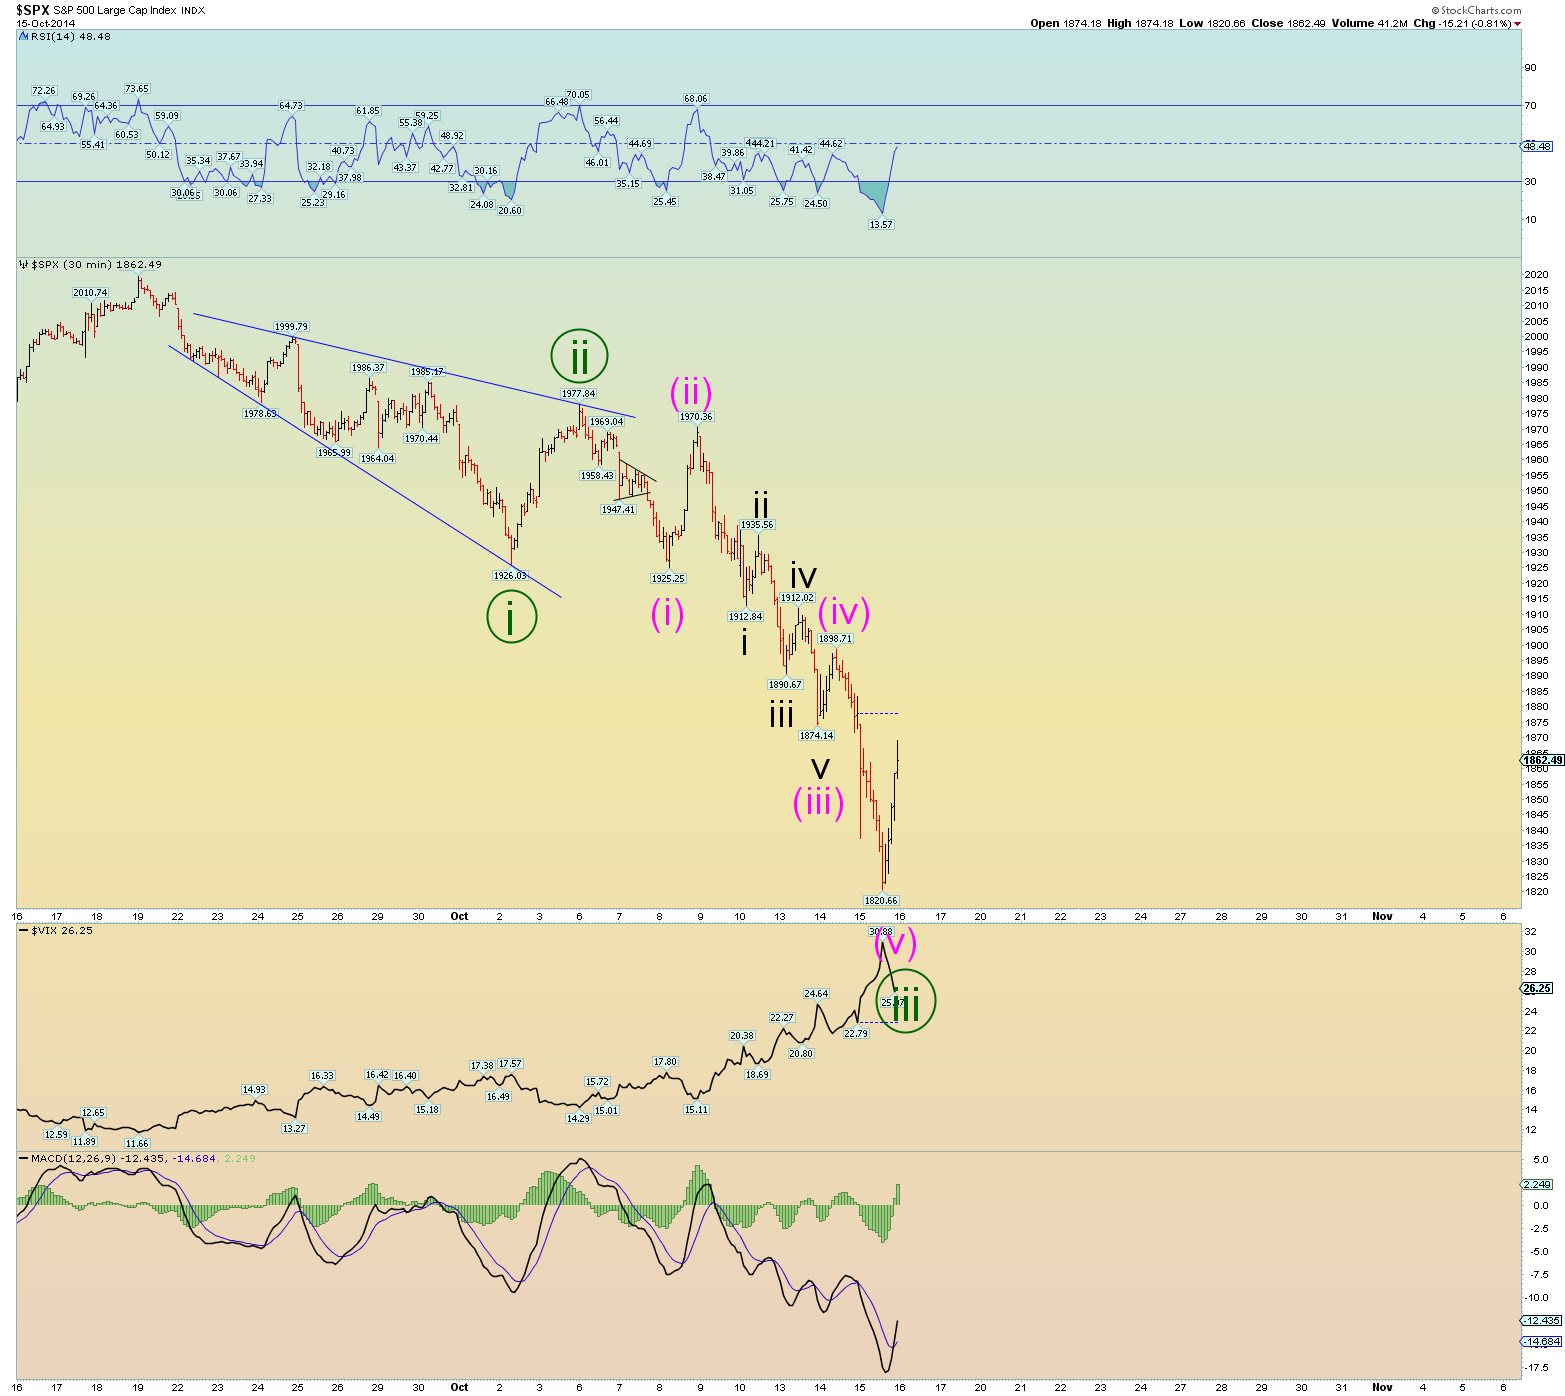
Best squiggle counts has us in wave (iii) at today's low or some time in the near future. But again, the DJIA needs to decline quite a bit more so we are best guessing here. The Fibonacci numbers work though.


Bonds are nearing or neared their rebound peak. Huge intraday yield swing (not captured on chart). Elliott Wave International (click on my links to left) has reported that daily bullish sentiment (via Trade-futures.com) on bonds were 96% yesterday. That is extreme and due for a turn.

BPSPX "decodes" the rise since 2009 as a double zigzag. Neat how that works? Now plunging and indicating that this is at least an Intermediate-sized wave move at the least.

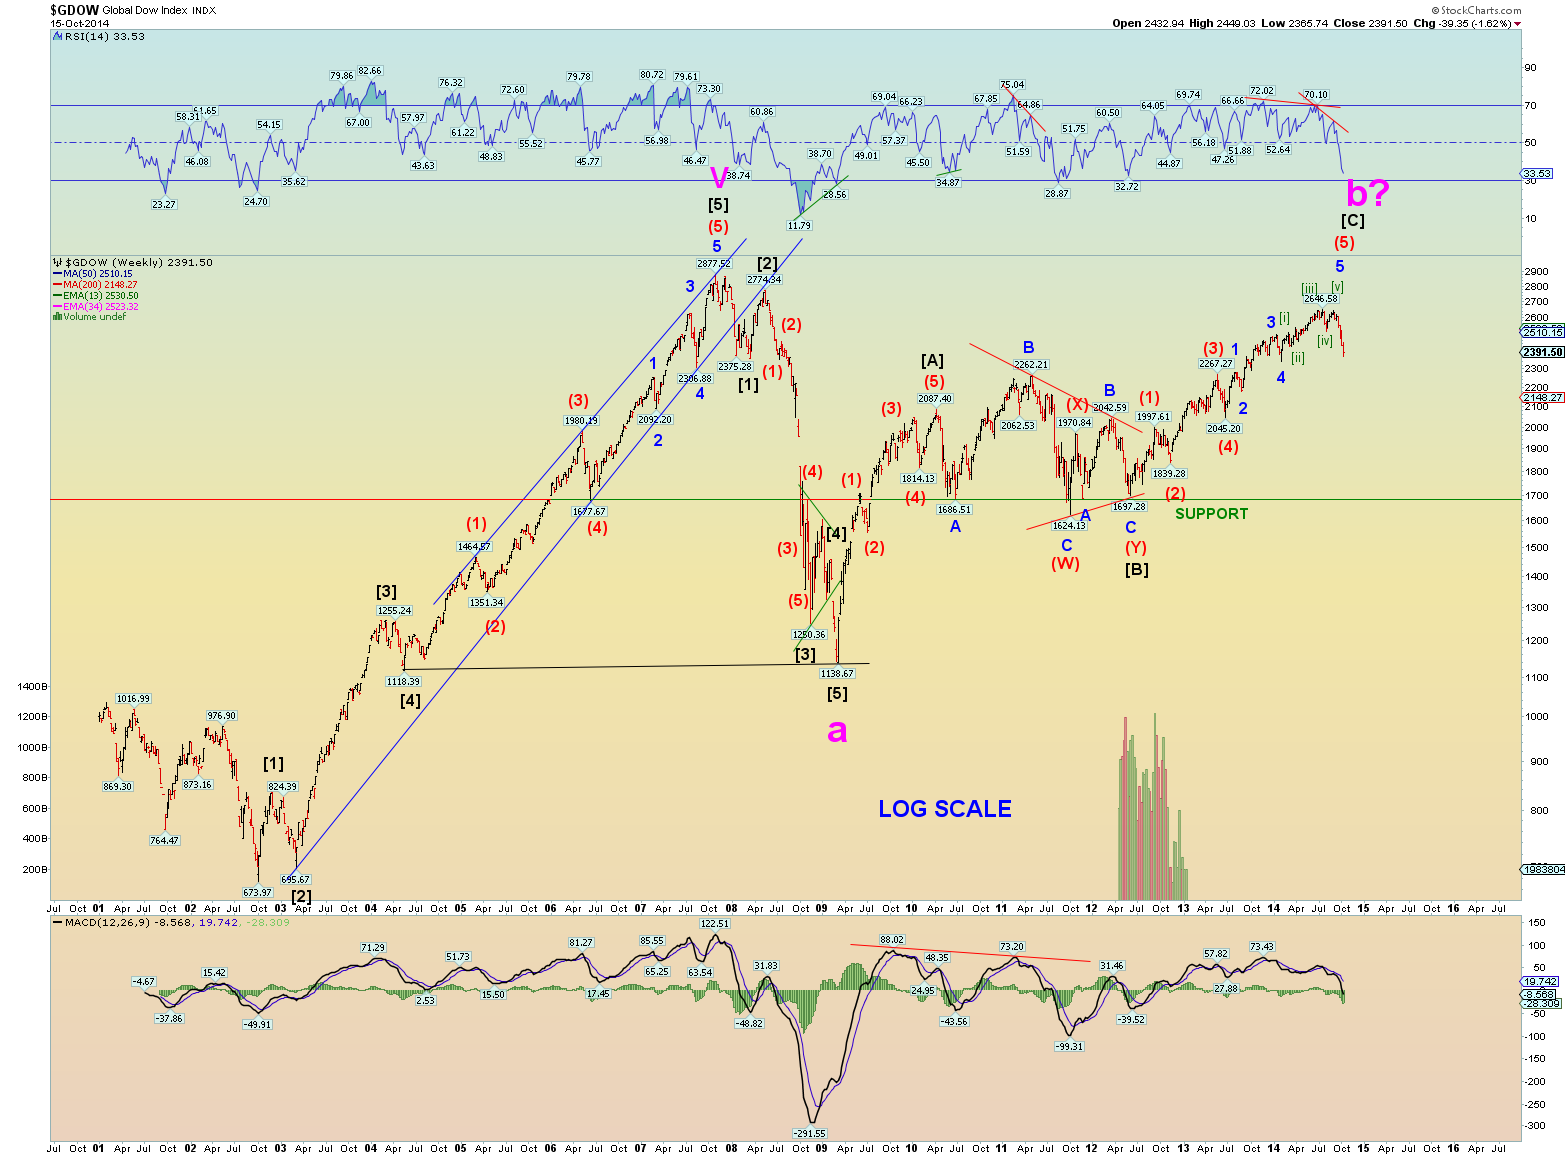
GDOW chart is a perfect example of an extended wave five (into its 2008 peak) that collapses back to its origin in a short amount of time. Took nearly 4 years from (4) to (5) yet collapsed back to (4) much quicker.

More posts from